Entrance footfall
Count people crossing selected entrances in each direction. Define how reports handle staff, repeat visits and incomplete coverage.

Custom retail software · Footfall and store insights
Understand how people move through your store. Digittrix builds custom retail video analytics for footfall, queues, store zones and dwell-time estimates. Give managers a clear view of activity across entrances, displays and branches, with reports that explain what each metric means.
Built around your workflow
Integrated with your operation
Tested with your team
The service, explained
Retail video analytics uses suitable store cameras to count entries, track activity in defined zones and estimate queue conditions or dwell time. We build the measurement rules and dashboards around your store layout and the decisions managers need to make.
What we build
Choose the features your team needs. We agree the scope, system connections and success criteria before development.
Count people crossing selected entrances in each direction. Define how reports handle staff, repeat visits and incomplete coverage.
Map camera views to aisles, displays and departments. Compare activity by time and zone to inform layout and staffing discussions.
Estimate time within visible zones when tracking quality supports it. Account for lost tracks, blocked views and repeat entries.
Define queue areas and alert thresholds. Notify staff when the agreed conditions occur and test the setup during busy periods.
Track agreed objects or observable actions. Give managers context to review an event before drawing conclusions about it.
Compare stores using consistent reporting rules. Connect supported point-of-sale data when your project needs a defined conversion measure.
How the software works
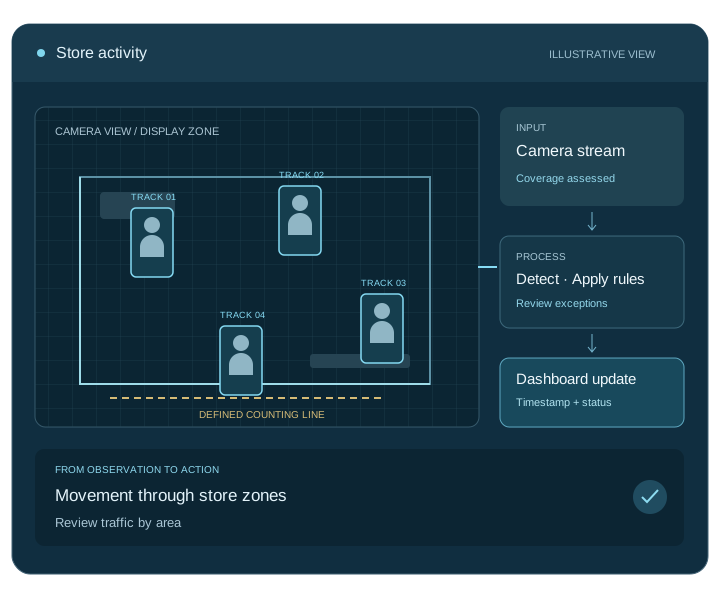
Select entrances, displays and operational zones.
Process agreed people or object events in each view.
Review zone activity, trends and configured alerts.
Share insights with store managers and operations teams.
Connect the complete workflow
We check access, compatibility and data ownership early. Each connection needs clear rules for permissions, failed requests and recovery.
| Connection | What we connect | What we check first |
|---|---|---|
| Store cameras | Entrance, aisle and display-area views | Coverage, lighting and accessible streams |
| Retail systems | Supported POS, CRM and reporting tools | Time alignment and agreed definitions for combined metrics |
| Branch dashboards | Store-level views and central reporting | User roles, comparable periods and consistent counting rules |
Test before you roll out
We agree measurable targets with your team and test representative inputs, including the difficult cases.
Compare directional counts with manually checked samples across quiet periods, busy periods and staff movements.
Check zone boundaries and lost tracks; document how occlusion and re-entry affect reported time.
Confirm time periods, camera coverage and counting rules are consistent before comparing branches.
Scope, cost and delivery
Start with one location and a clear operational question. We assess the footage, test a pilot and agree the development milestones with your team.
We provide a project-specific estimate and milestones after discovery. Your proposal separates development from ongoing operating costs.
Get a project estimateWe agree source-code and licence terms, deployment access, documentation, team training and support responsibilities in your proposal.
Map the workflow, inputs and system connections.
Test the core task and agree acceptance targets.
Build the application, integrations and admin tools.
Validate, deploy, train your team and start agreed support.
Your development partner
Digittrix Infotech Private Limited builds business software from Mohali, India. Explore our team, published work and client feedback as you choose your development partner.
Our published account describes movement inputs connected to an internal app and a web dashboard, with traffic views and historical reports.
Read the IKEA project account ↗These accounts describe the delivered projects. We assess the camera and AI requirements for your project separately.
Answers before you build
We assess your streams, placement, lighting and image quality first. A pilot shows which footfall, zone or queue measurements the existing coverage can support.
No. Many entrance and zone-counting workflows work without identifying shoppers. We treat identity matching as a separate requirement.
Yes, where camera placement and tracking quality support useful estimates. We define the zones and explain how blocked views or lost tracks affect the reports.
We assess the POS system’s data access and align the reporting periods. We then define the conversion measure with your team; camera counts alone do not prove purchases.
Our IKEA customer-traffic management account describes movement inputs connected to an internal app and web dashboard. The linked case study explains that project’s scope. We assess your camera and analytics requirements separately.
The number of stores, cameras and zones sets the starting scope. Dwell-time tracking, queue alerts, POS connections and reporting requirements add development and testing work.
Let’s plan your project
Tell us about your locations, camera setup and current systems. We will help you define a practical development plan.
Service information updated .